Average real estate price in each district in Riyadh
1 Overview of the dataset
Aqar (عقار, “Real estate”) is Saudi Arabia’s biggest specialized online marketplace for—you guessed it—real estate. In 2021, 3718 rental listing were web scraped from Aqar, covering the kingdom’s 4 major cites: Riyadh, Jeddah, Khobar and Dammam, in order to know more about the rental prices across the cities and what features affects it the most.
The observations of the dataset were described using 24 features as follows:
| Feature | Description |
|---|---|
| city | city where house locate in |
| district | district where house locate in |
| front | What is the house front is north, west .. etc |
| size | size in m^2 |
| propertyage | property age for the house |
| bedrooms | number of bedrooms |
| bathrooms | number of bathrooms |
| livingrooms | number of livingrooms |
| kitchen | show whether the house have a kitchen or not garage |
| furnished | show whether the house is furnished or not |
| ac | show whether the house have a ac or not |
| roof | show whether the house have a space for roof on top or not |
| pool | show whether the house have a pool or not |
| frontyard | show whether the house have a frontyard or not |
| basement | show whether the house have a basement or not |
| duplex | show whether the house is a duplex or not |
| stairs | show whether the house have a stairs or not |
| elevator | show whether the house have an elevator or not |
| fireplace | show whether the house have a fireplace or not |
| price | show the price of the house |
| details | shows any additional details from the house owner about the house |
2 EDA
We can see that western north has the highest prices, which happen to be the area with the newest neighborhoods and where many companies’ headquarters are.
In this and the following maps not all districts are shown and that to keep the numbers as accurate as possible, since many districts have one or two rental units only which is not enough to be representative of the districts’ rental prices.
The average prices vary across the districts in the kingdom’s capital, ranging from around 35,000 SR to x8 times the price at 296,000 SR.
This may seem unreasonable especially since it does not mention the type of the property.
Average real estate price in each district in Jeddah
Average real estate price in each district in Khobar
Average real estate price in each district in Dammam
Although the dataset does not include information about all districts in all cities; this lack of information is more apparent in Khobar and Dammam which have only 5 and 6 districts respectively.
Another expected pattern can be seen in Jeddah and Khobar and Dammam where the highest prices of properties along or near to the sea. Yet some districts in Khobar, such as Sawari and Aqiq districts are fairly close to the sea yet have average prices, which is probably due to its distance from central Khobar.
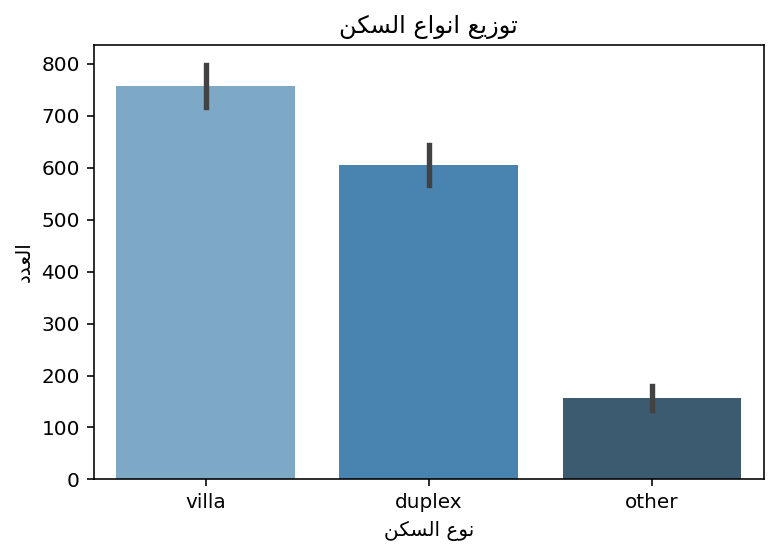
The average price across all cities was high but made since after looking at the distribution of the property types.
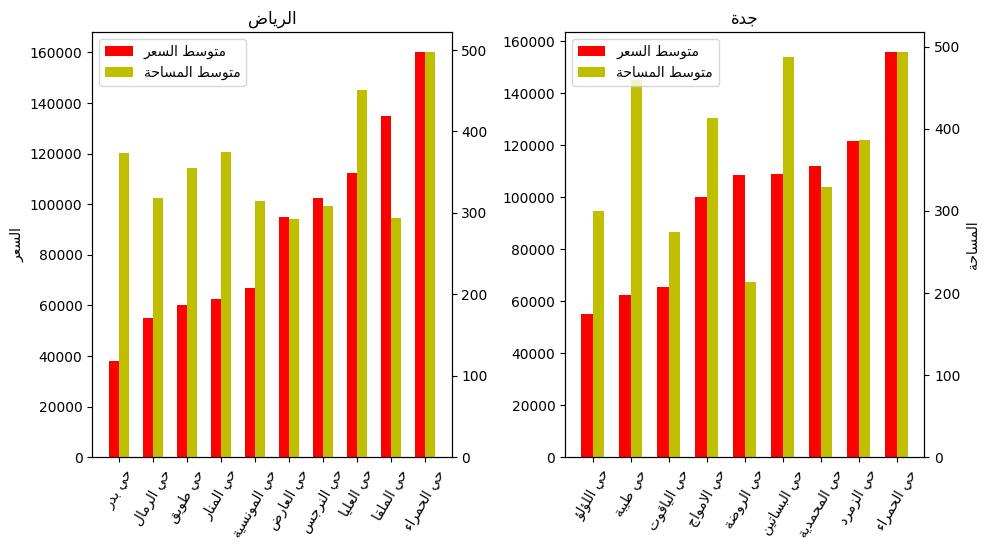
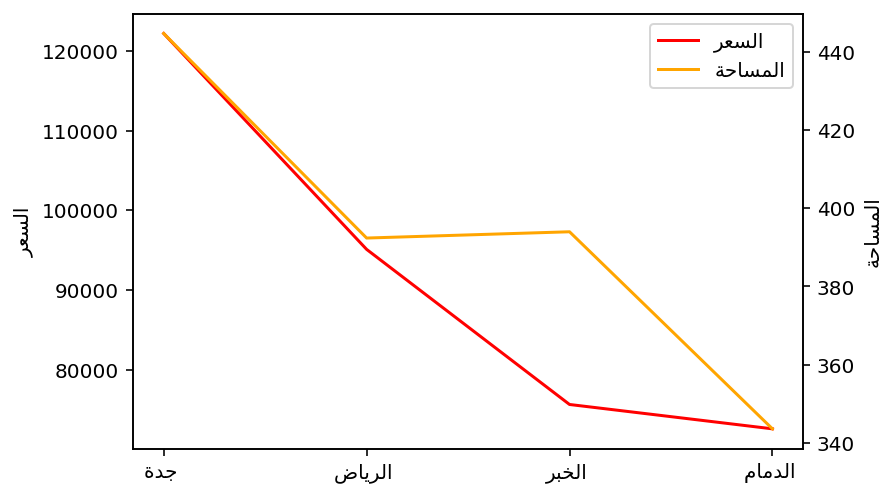
To have better understanding of the prices we need to take more than one variable at once and see how they affect the price.
Distribtuon of real estate per size for each city
Distribtuon of real estate per age for each city
From the graph we first see:
- How imbalanced the dataset it in terms of the number of observations per city.
- Most of the properties have size <500 meter squared.
- In Riyadh most of the properties have price <150,000 SR and <100,000 for Khobar and Dammam. Jeddah has no clear pattern.
- Unlike villas, the sizes of duplexes are similar across all cities.
- Villas in Khobar are larger and pricer than Dammam.
| city | district | price | |
|---|---|---|---|
| 0 | جدة | حي الروضة | 253263.157895 |
| 1 | جدة | حي الشاطئ | 166500.000000 |
| 2 | الرياض | حي الملقا | 135000.000000 |
| 3 | الرياض | حي الروضة | 126538.461538 |
| 4 | الرياض | حي المحمدية | 125000.000000 |
| 5 | الرياض | حي العليا | 112419.354839 |
| 6 | جدة | حي المحمدية | 108043.478261 |
| 7 | الرياض | حي العارض | 104144.578313 |
| 8 | الرياض | حي النرجس | 102542.857143 |
| 9 | الدمام | حي ضاحية الملك فهد | 76648.648649 |
Highest average price districts
The following questions were in mind during this part of the EDA:
Covariance: What is the factor that when present increases the price the most?
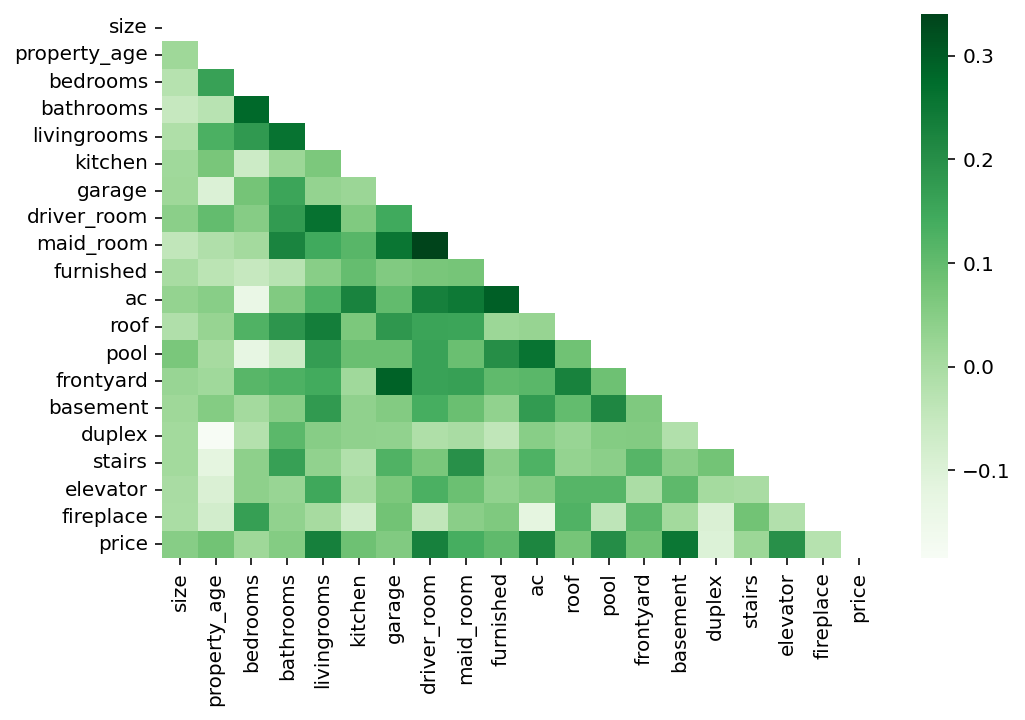
As we can see in the matrix, we can observe that there are 4 major features that are considered higly correlated with price, these are:
livingroomsdriver_roombasementelevator
How about a deep look at each feature with the price:
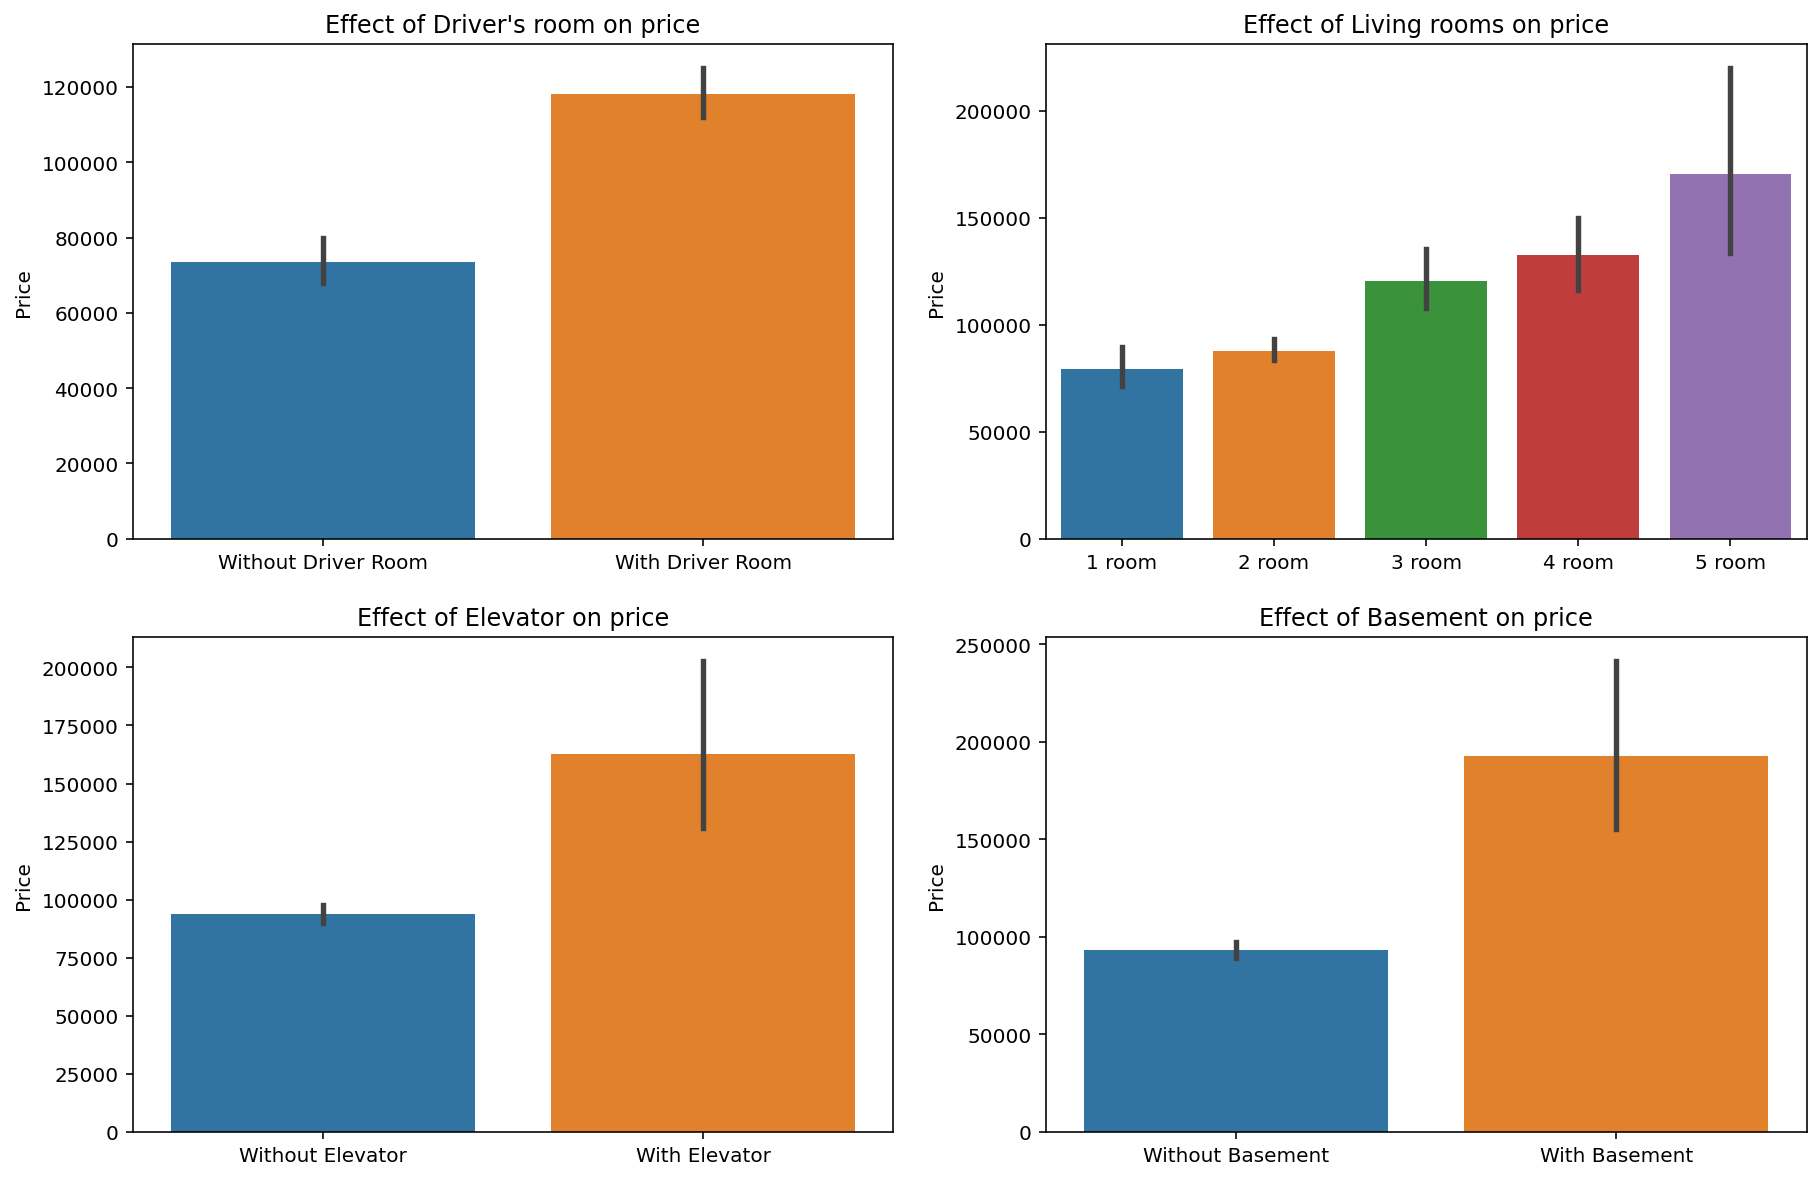
We can conculde the following based on the feature plots:
Tip
On average, properties with a basement room tend to be showcased at a higher rent rate.
Location: How are the properties with these features distributed across the cities?
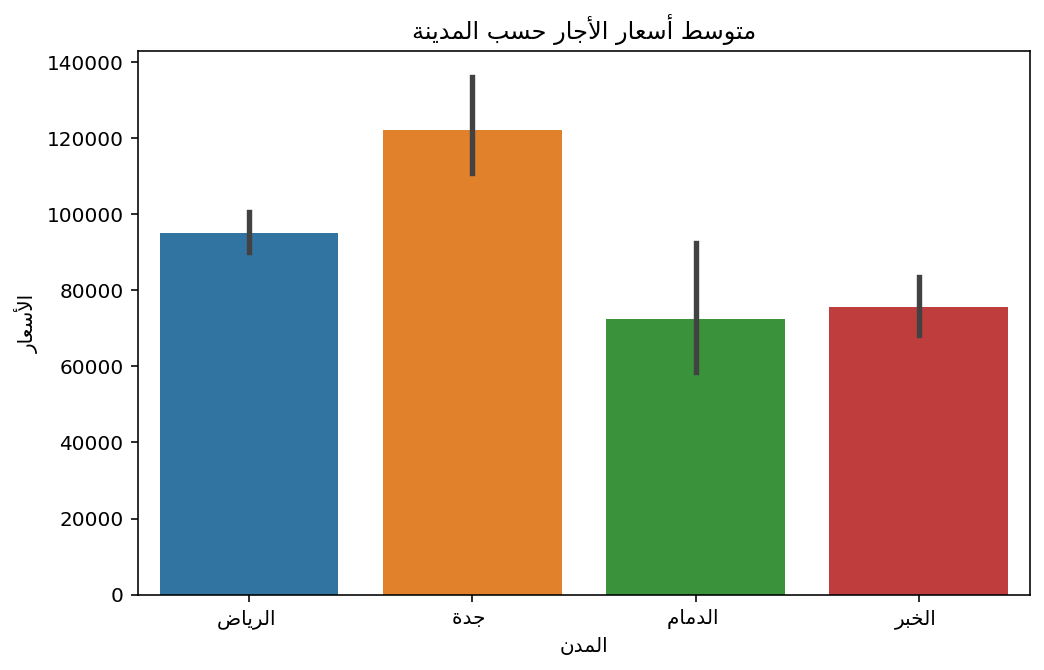
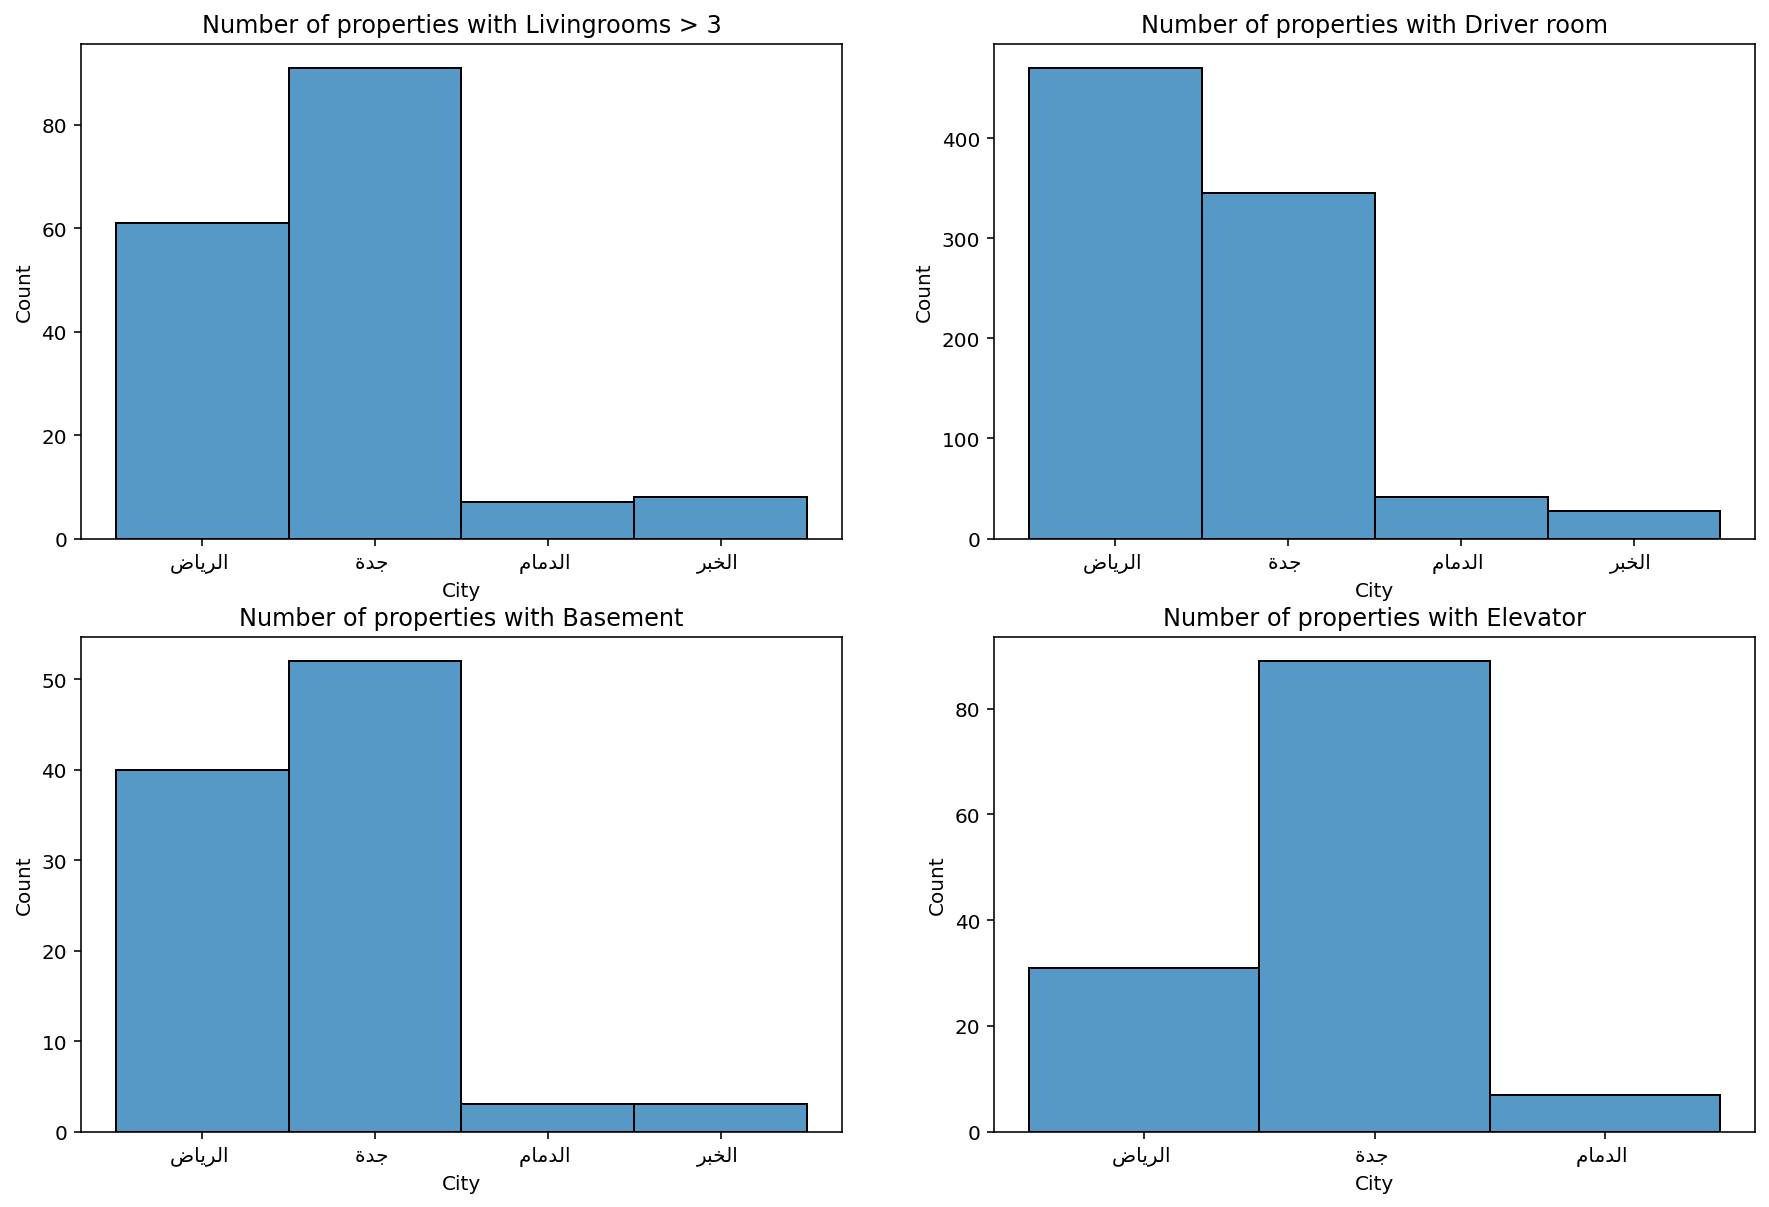
We can conculde the following based on the @featuresInCities figure:
Tip
On average, these properties tend to be located in Jeddah, where we also notice its possession of high rental rates.
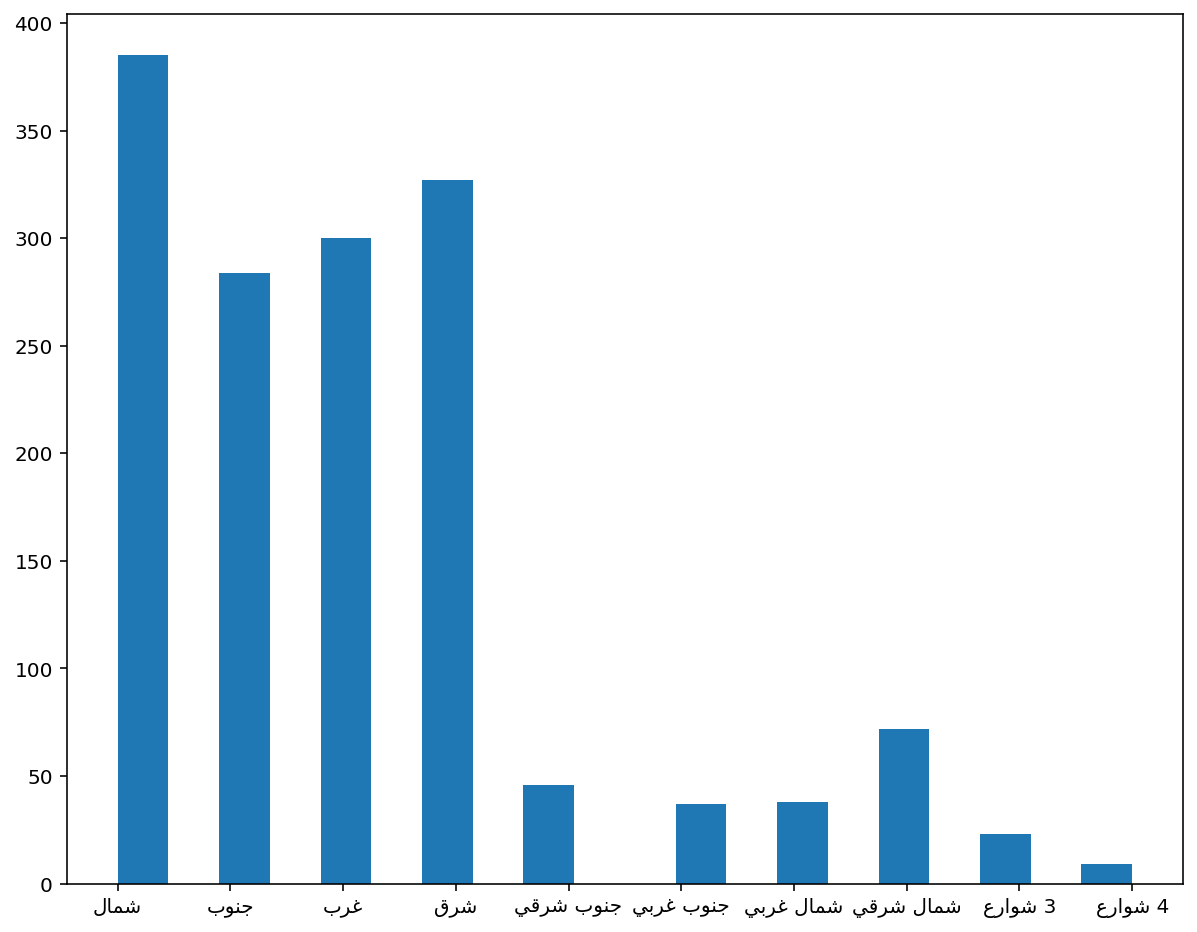
What frontage appears the most
What the ratio of bedrooms and living rooms to bathrooms and does it reflect the market demand
1.0995726495726494Investigate rental units without kitchen
<AxesSubplot:xlabel='bedrooms', ylabel='Count'>
The location of a house may be the most significant factor in determining the price, we don’t have that in the dataset. Perhaps we can create this attribute.
| district | |
|---|---|
| 0 | حي العارض |
| 1 | حي القادسية |
| 2 | حي القادسية |
| 3 | حي المعيزلة |
| 4 | حي العليا |
| 5 | حي الازدهار |
| 6 | حي المهدية |
| 8 | حي الحزم |
| 9 | حي العليا |
| 10 | حي العارض |
Let’s check the new attributes we created
| latitude | longitude | city | |
|---|---|---|---|
| 0 | 24.789505 | 46.811889 | الرياض |
| 1 | 32.845004 | 13.082073 | الرياض |
| 2 | 32.845004 | 13.082073 | الرياض |
| 3 | NaN | NaN | الرياض |
| 4 | 25.359219 | 49.596119 | الرياض |
0.11672942442173212We need to process the data to turn it longitude and latitude (and city) into which part of the city a house belongs.
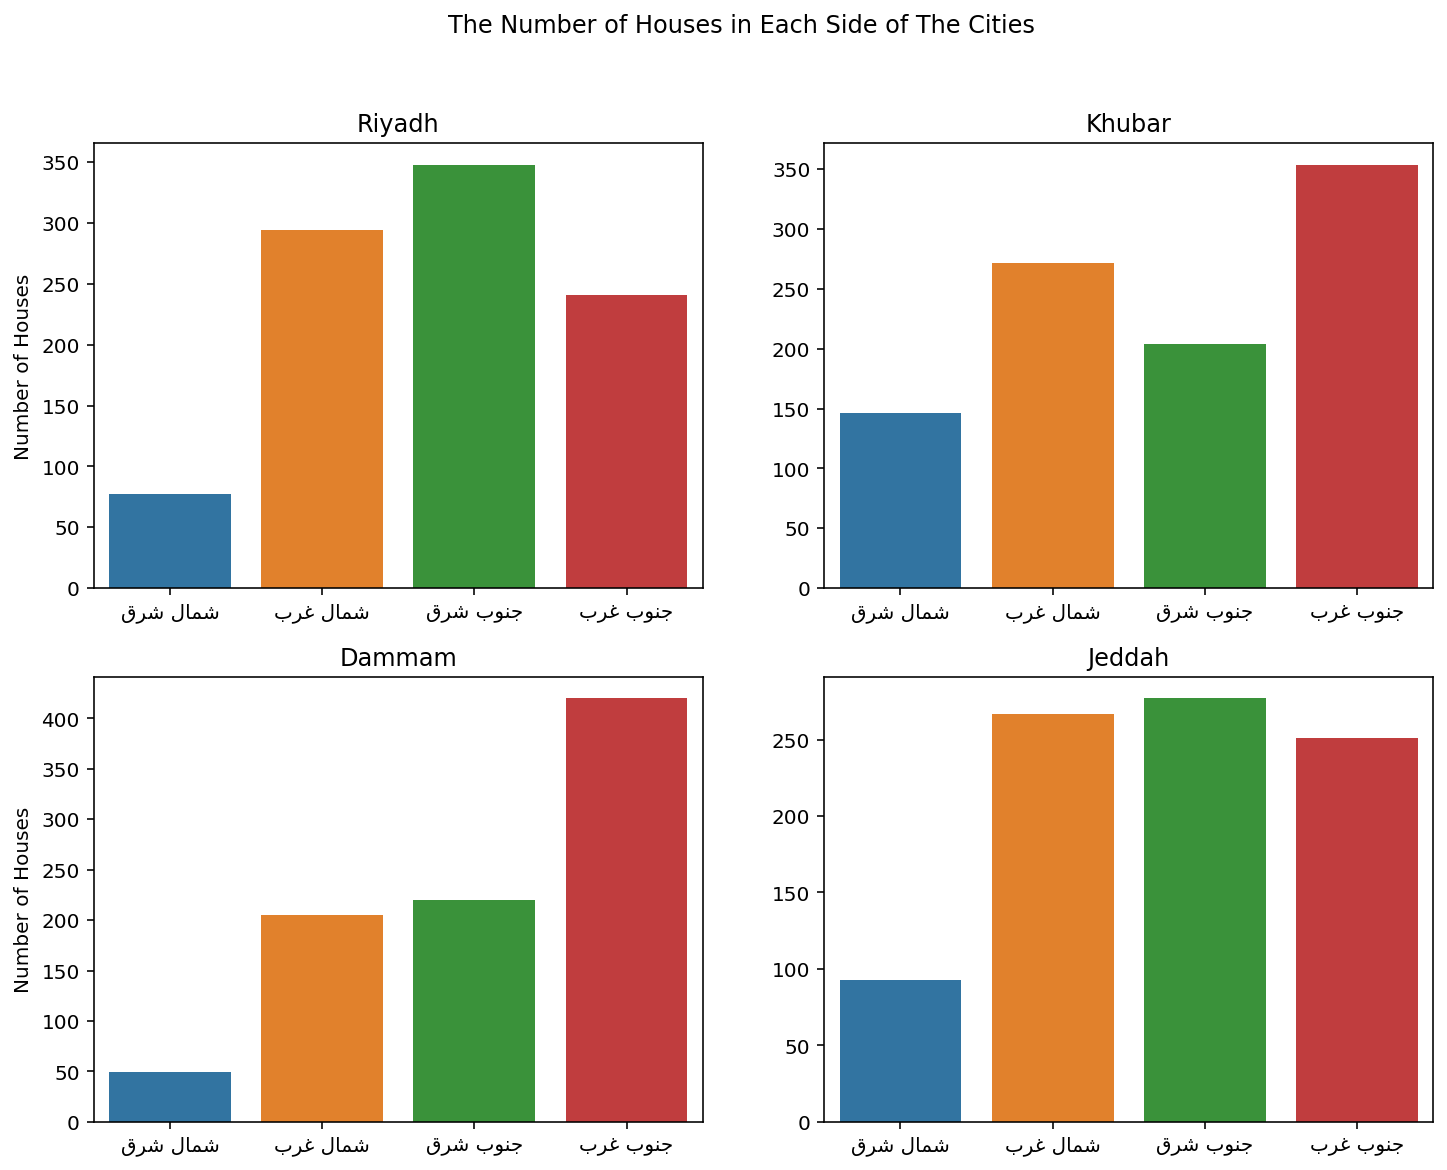
Let’s visualize some basic statistics using the new attribute
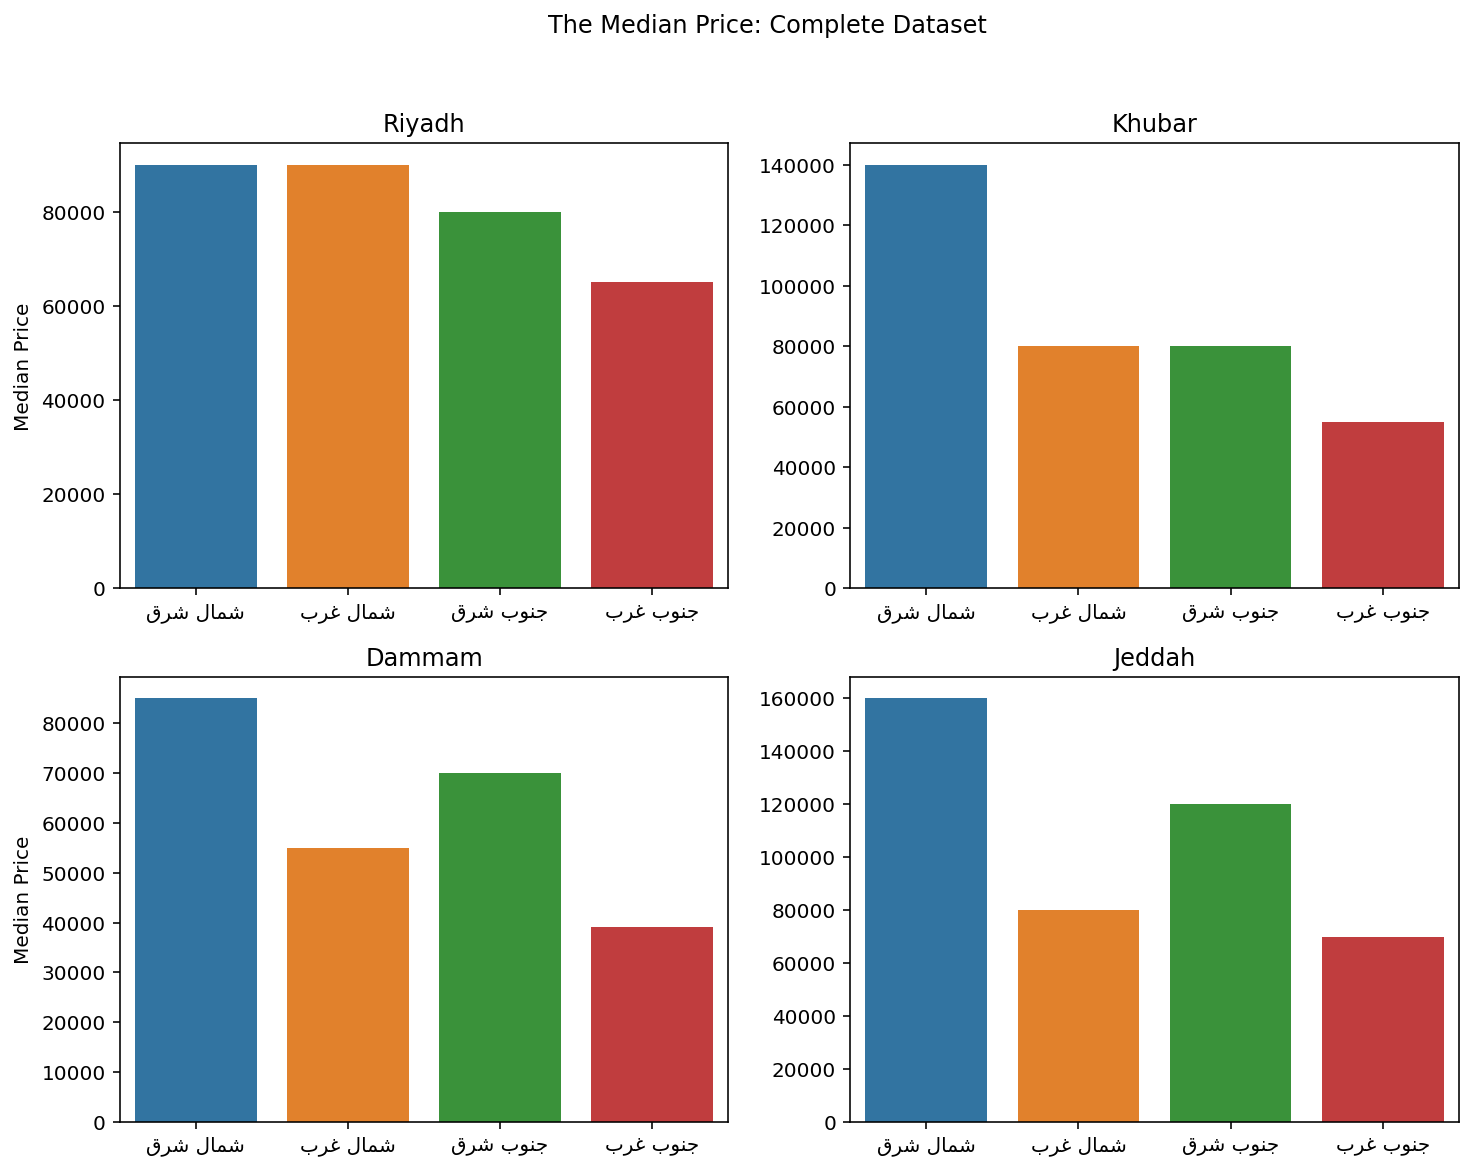
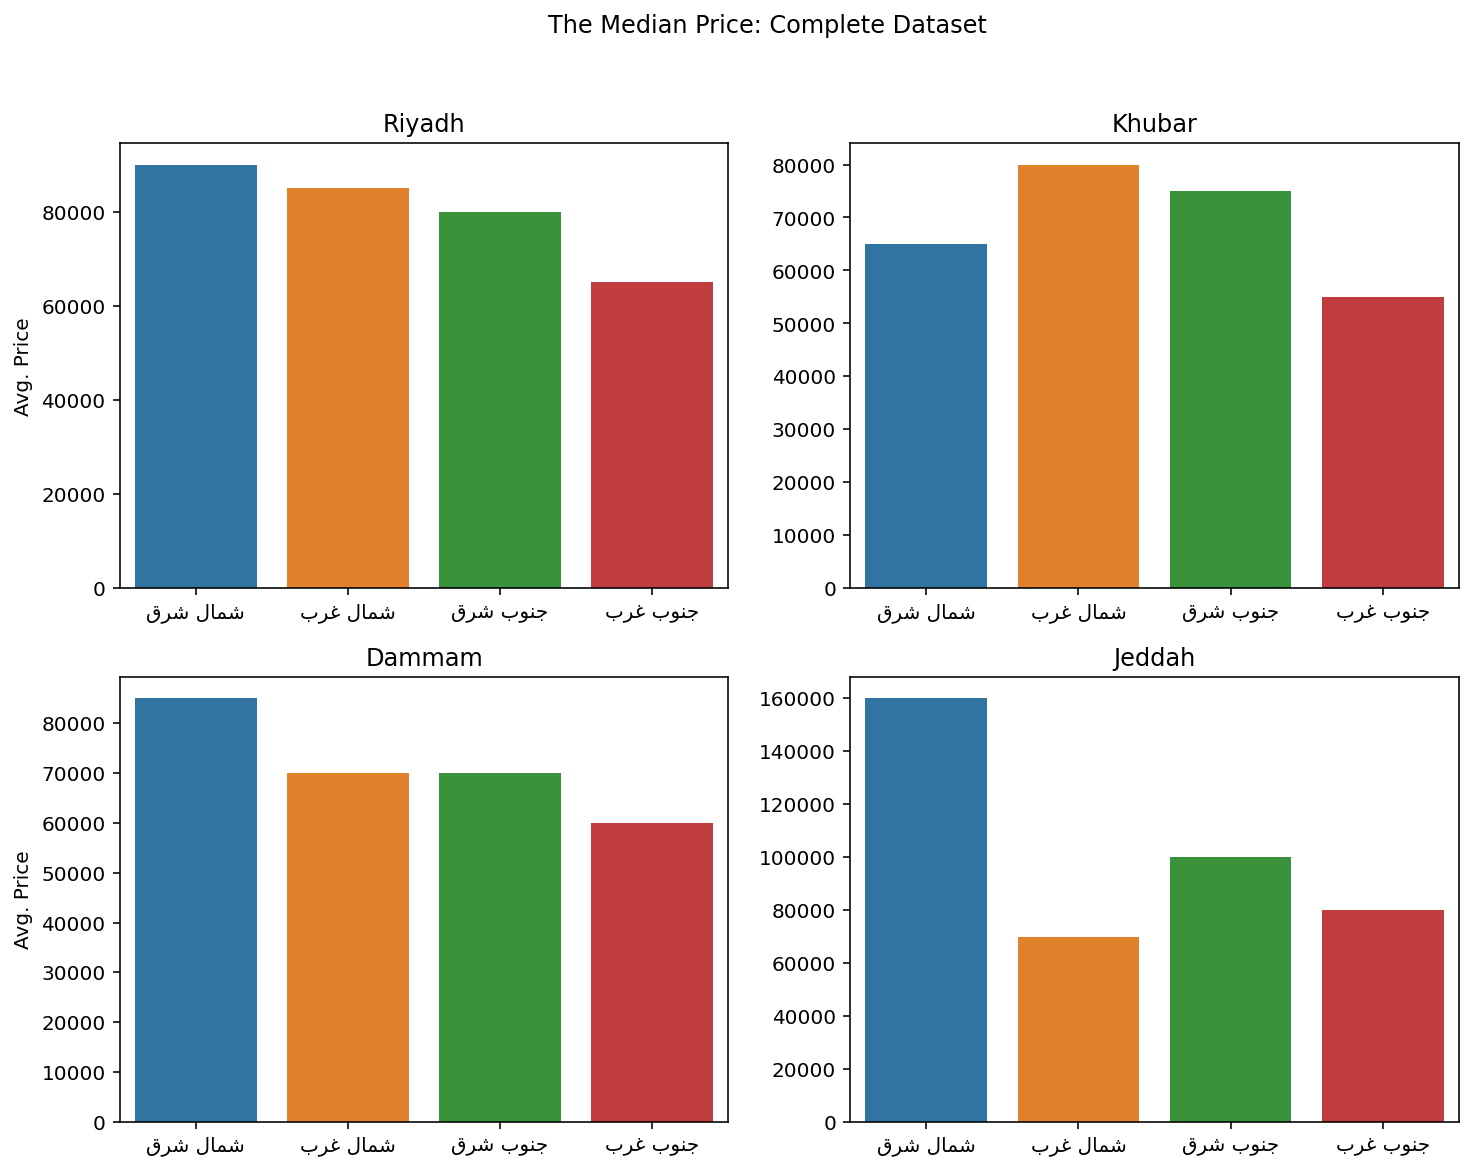
The north east is the most expensive part of every city! (Except in Riyadh it’s a close second).
The north east is the most expensive part of every city! (Except in Riyadh it’s a close second).
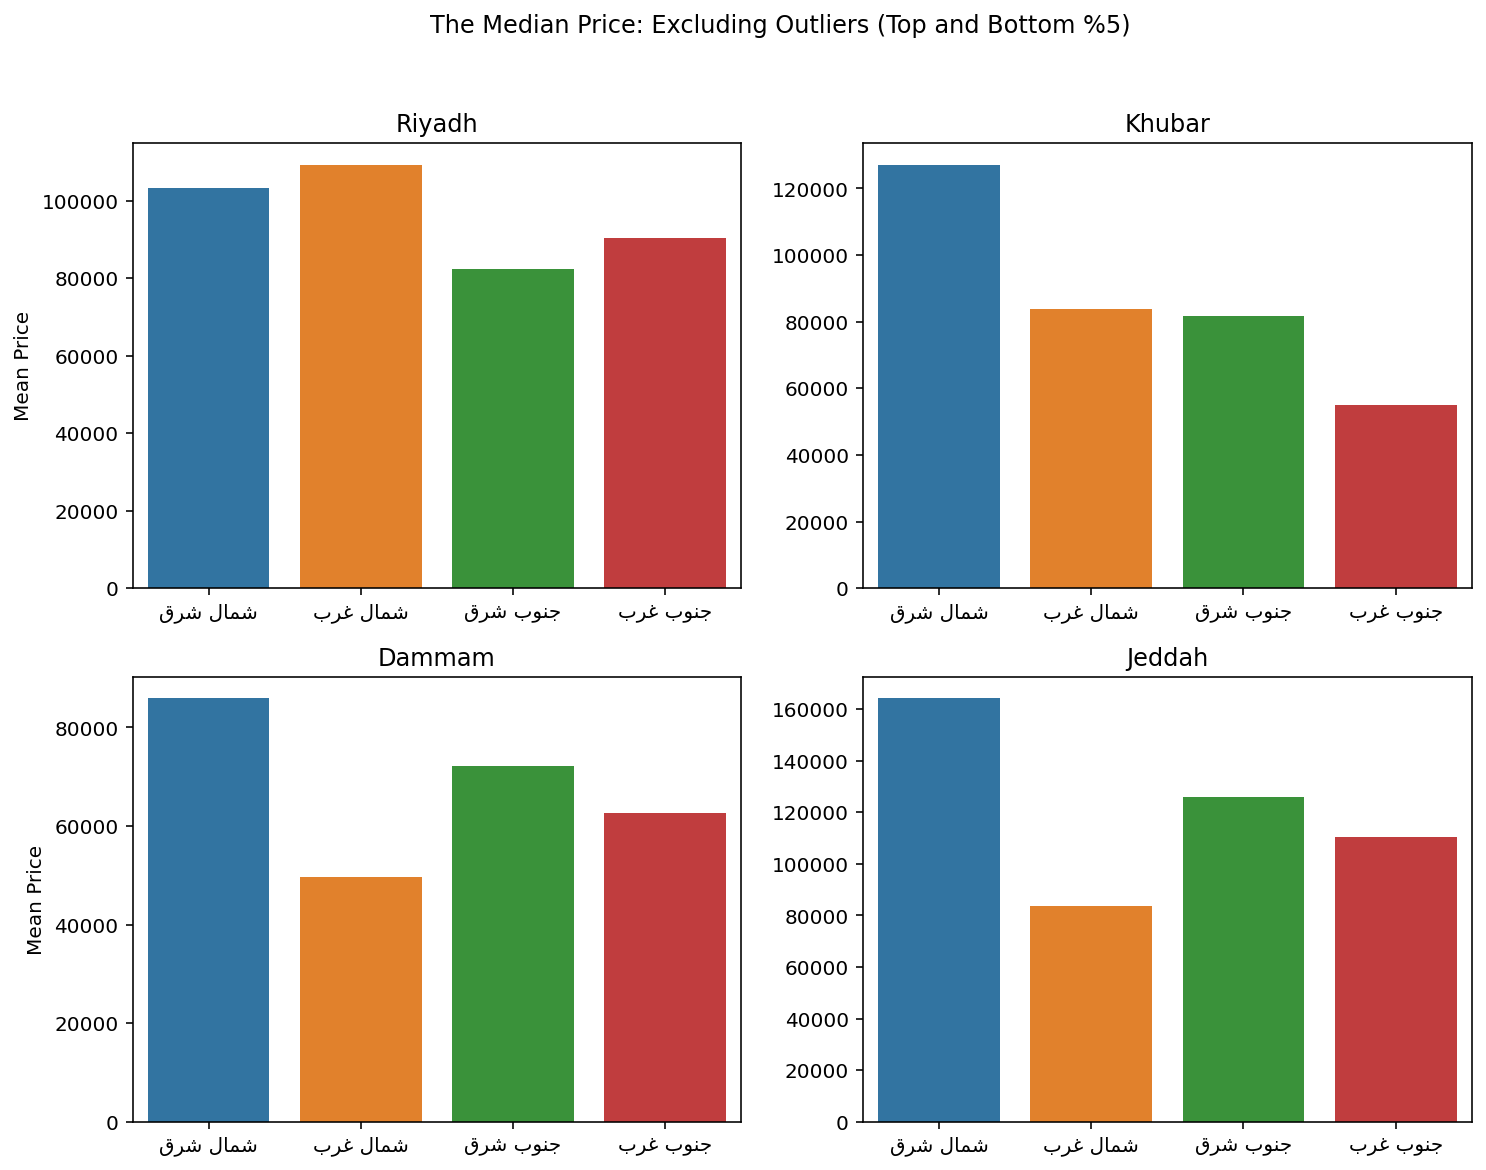
How would the plots look if we chose the trimmed median instead of the median?
3 Overall Conclusion
In conclusion:
- We identified the highest price district, the best districts in Jeddah and Riyadh in terms of size.
- The rental rates are high in Jeddah compared to the other cities, where also the features that increase the price are found in their properties.
- The north region in each city tends to be the most expensive.
- In each city, houses located in the southern side of the city were most prevalent.
4 Challenges Faced
During this assignment, we faced some obstacles that include:
- Plotting Arabic labels in the correct formatting.
- Genearating mutliple plots and interacting them with Seaborn plots.
- Conflicts with team working and collaboration.
- 60% of the dataset were duplicates, which may be a bug or because people post more than once, so we had to work with only 1400 observation to conduct the analysis.
- Data cleaning.
5 Resources
Saudi Arabia Real Estate (AQAR), Rental house dataset for Riyadh, Jeddah, Dammam, and Alkhobar. https://www.kaggle.com/datasets/lama122/saudi-arabia-real-estate-aqar.
6 Source Code
This report is hosted on Github Pages and the repo can be accessed via this link.